debugger in javascript
debugger plays an important role when using javascript, it is used for debugging your code in a faster way.
It helps in debugging when an unexpected error/output appears.
debugger;
1) Open your browsers inspect element window before pressing run() button.
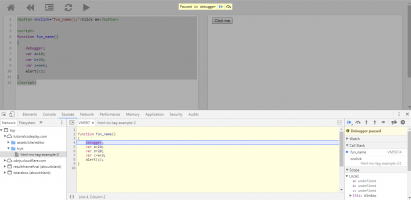
2) When the statement marked for debugging execute, the execution will be paused and waits for user action.
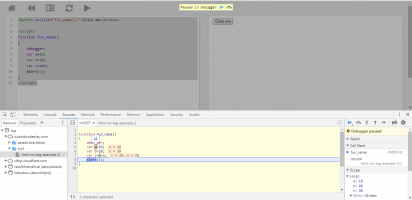
3) You can then execute the lines one by one, by pressing F10 button. We can see how the values are assigned and executed.
Our in-build editor does not support debugger in firefox, so create an separate .html file and enter the following codes. Then you can debug your code in firefox.

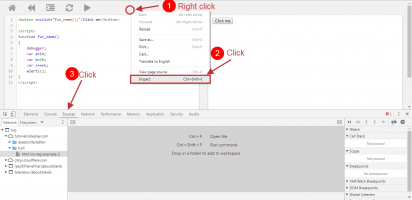
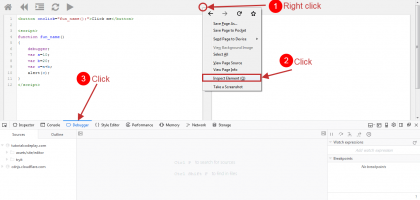
Place runtime debugger
Without entering the debugger keyword we can place the debugger point during runtime without reloading the web page.
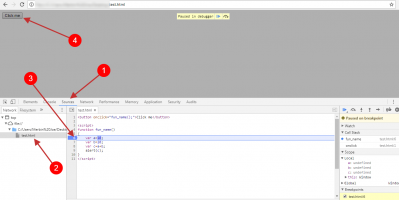
- First you need to open the inspect element window by pressing F12 or right click and select Inspect(chrome) or Inspect element(firefox).
- Select the source tab.
- Select the html page or js file, where you want to put the debugger point.
- When the debugger point is executed, the program execution is paused and waits for user action.
- Press F10 to continue the execution line by line.
Browsers doesn't support run time debugger in our in-build editor. Save the following program in a separate .html file and try the above steps.